
Blog
Predictive Analytics – Part 2

Blog
Predictive Analytics – Part 2


In Part 1 of this blog series, we learned about Predictive Analytics and why it is booming, covered the risks of False Positives, bias creeping in, problems caused in training a model, while understanding the algorithms used in predictive analytics and the use of crowdsourcing technique.
In this Part 2 of the blog, we will learn more about correlation and causation, ‘Vast Search’ and the “Curse of Dimensionality’, why PA identifies only micro risks, Ensemble Models, Persuasion Modeling, Survival Analysis and the importance of ethics in Predictive Analytics.
When PA predicts that one observation has a similar observed pattern as another or is correlated with another, it doesn’t mean that one is the cause of the other. This interesting feature is discussed next.
Correlation does not necessarily mean causation:
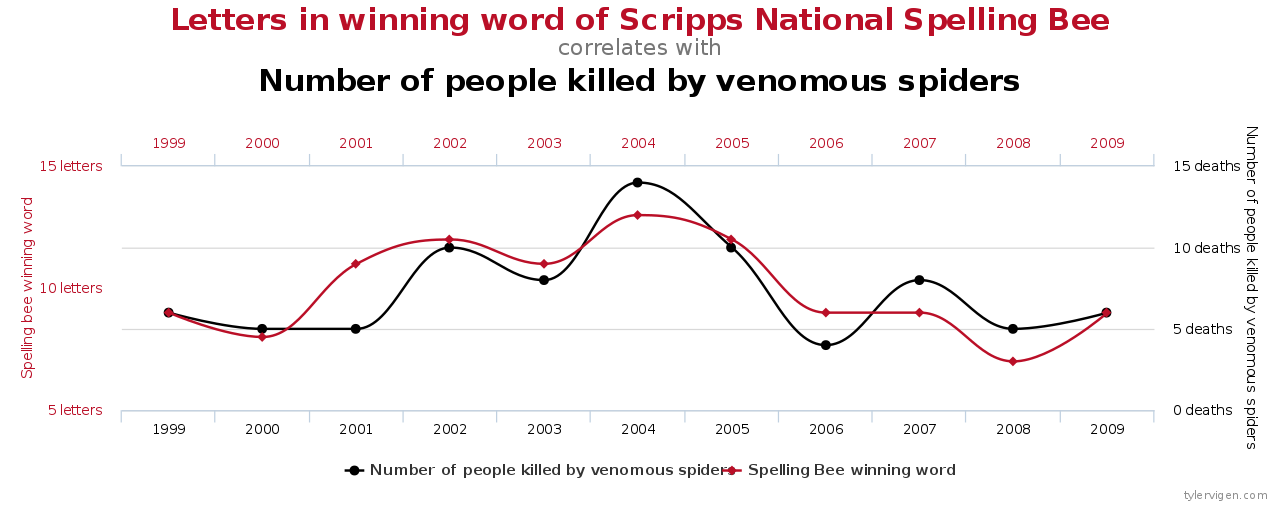
Predictive analytics is used to determine the correlation in data or observations. Since very often patterns or correlations are observed in the data analyzed, people tend to think that two observations that show a relation also support causality. But correlation does not necessarily mean causality and it shall not be misunderstood as such.
PA has predicted that as the sales of ice cream increases, the rate of drowning deaths increases sharply. That does not mean that ice cream consumption causes drowning and that we should take the action of stopping ice cream sales to prevent death by drowning. The possible explanation is that in summer ice cream consumption is more and in summer more people engage in waterborne activities like swimming and the increased drowning deaths are caused simply by excess exposure to water-based activities, not ice cream. The figure below is a graphical representation of correlation that doesn’t necessarily mean causation.
Using too many features in the training data can prove to be disastrous. This aspect, also known as “Vast Search” and alternatively also as “Curse of Dimensionality”.
Using Vast Search? Be watchful!
Because of the abundance in available data, people often use data consisting of a large number of variables or parameters (features) to conduct PA activities. This is termed as “Vast Search”.
When such a large number of input parameters are used, the PA application may find a correlation or pattern (False Positive) in the data purely out of coincidence or chance and which may not be true at all.
The “Curse of Dimensionality”:
Vast Search can also be interpreted as the problem of the “Curse of Dimensionality” which occurs when data with too many variable or features are used in creating the model. Any ML or PA algorithm requires data in the form of numbers fed in a tabular format, where the columns may be the features (attributes) and each row, a unit of analysis. When the number of columns (features) far exceeds the number of rows (records), then it may lead to the curse of dimensionality. The exponential growth in data because of the inclusion of too many features causes the data set to become highly sparse and unnecessarily increases storage space and processing time for the particular modeling algorithm. And that’s why it’s called “The Curse of Dimensionality”. The amount of overhead this data adds to the algorithm is far more than the value added by the additional dimensions.
Let’s talk about the types of risks that a PA application can handle.
Micro & Macro Risks in Predictive Analytics:
Micro risks are relatively smaller risks like predicting stock market prices whereas Macro risks are larger risks that can be stock market crashes or a rare catastrophic event, like the Great Economic Recession that occurred in 2008. PA can predict micro risks and not macro risks because the occurrence of macro risk events are rare making it difficult for the PA model to predict.
What are Ensemble Models? Why are they advantageous?
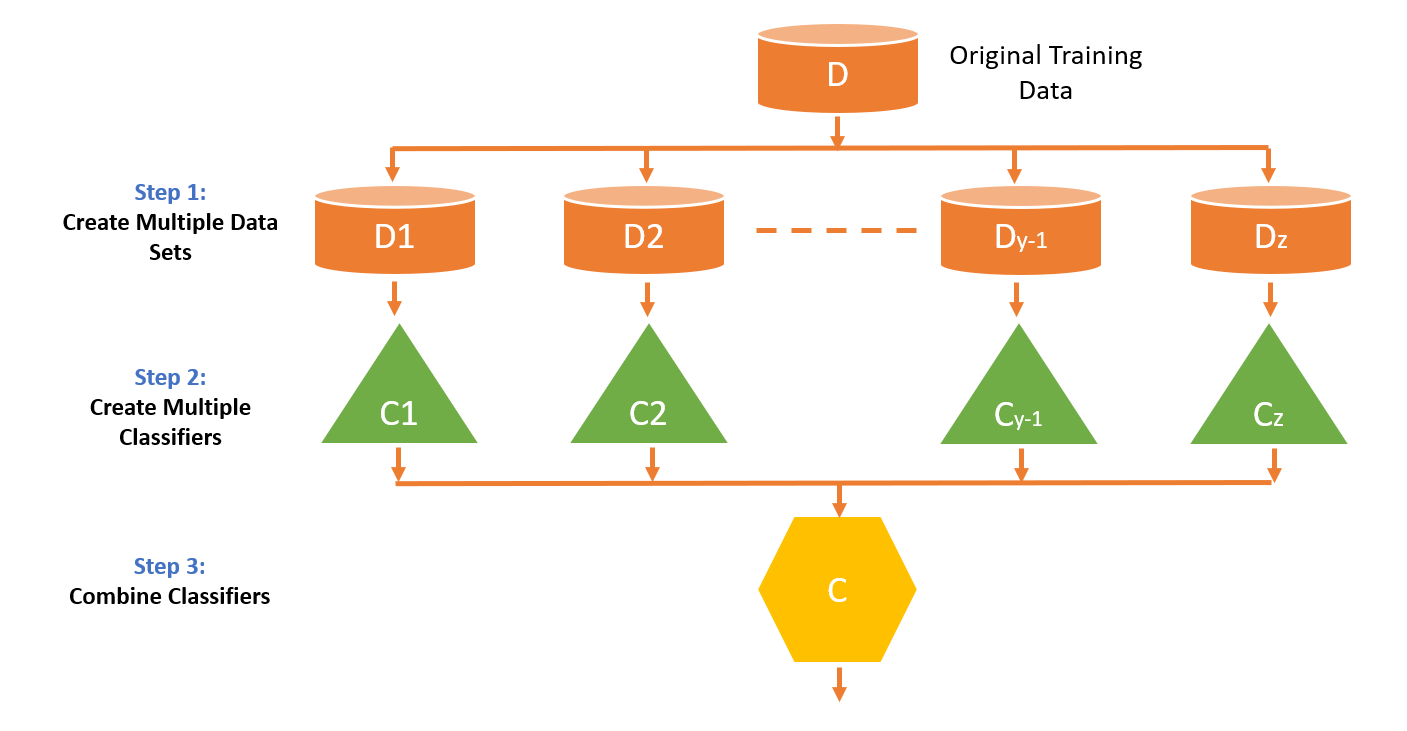
Multiple models are used in the PA activity to increase the accuracy or to make the model more operationally effective i.e. to be able to effectively address the business problem it is intended to solve. These models are known as ensemble models.
In the Netflix competition of creating a PA model to increase its movie recommendation predictions by 10%, (as explained in Blog Part 1), two rival competitors collaborated together and merged their predictive models to create an ensemble model that had a higher accuracy than each of their individual models.
When ensemble models are used, the lower accuracy and the drawbacks of one model are compromised for/ by the other model due to which the resultant model is more accurate.
In ensemble models, another model is created above the two individual models. If there is a disagreement between the predictions of each model, then the main model takes the better of the predicted scores.
Ensemble models are now becoming very popular and are known to be resistant to overfitting.
Ensemble Models:
The next section talks about a real example of the use of ensemble models in Predictive Analytics which was used in building a computer that could answer any open-ended question in a quiz competition and eventually win the competition by outperforming humans.
Watson and the Jeopardy Challenge:
The Watson computer was developed by IBM in order to compete and eventually win the popular quiz show “The Jeopardy Challenge” which was aired on a popular American TV channel.
Watson consisting of an ensemble of ensemble of ensembles was trained to answer any of the open-ended questions posed in the competition.
With so many models to process and the need to access and search stored information like Wikipedia articles, digital newspaper articles and contents, databases and other sources of information, speed was an important factor because the quiz question posed had limited time to be answered.
In order to meet this challenge and make the computer thousands of times faster and achieve the requisite computing power, Watson employed thousands of CPUs. It consisted of a cluster of 90 servers consisting of 2800 core processors, handling 80 trillion operations per second.
It favors 15 terabytes of RAM over slow hard drive storage. Please refer our Whitepaper for more details.
One of the new areas of Predictive Analytics called Persuasion Modeling, which can be a game changer in predictive activities, is discussed next, after which another facet of PA called Survival Analysis is discussed.
Persuasion Modeling/Uplift Modeling/Net Lift Response Modeling:
Persuasion Modeling uses PA to predict who can be persuaded to buy, respond or vote. Generally, PA is used to create segments of respondents based on which decisions or actions are taken. In Persuasion modeling, the aim is to target each individual separately i.e. customization based on a single individual.
For example, a difference between standard response modeling and persuasion modeling is as follows:
Standard response modeling predicts -: Will the customer buy if contacted?
Uplift or Persuasion Modeling predicts -: Will the customer buy only if contacted?
There are four types of customers -:
1) Persuadables -: Won’t buy if not given an offer. Will buy if given an offer.
2) Sure Things -: Will buy if not given an offer or if given an offer.
3) Do not disturb -: Will buy if not given an offer. Won’t buy if given an offer.
4) Lost cases -: Won’t buy if given or not given an offer.
The idea is to contact only the “Persuadables” by way of mailers, email or physical visits. This way the company can save money that would otherwise be spent also on the other three categories of customers.
What is Survival Analysis?
Survival analysis is another name for time-to-event analysis. These techniques primarily find application in the medical and biological sciences, but they are also widely used in the social sciences like economics, as well as in engineering (reliability and failure time analysis).
Survival analysis is generally defined as a set of methods of data analysis wherein the outcome variable is the time until the occurrence of an event of interest. The event could be marriage, divorce, death or the occurrence of a disease, etc. It can be used to predict failures or breakdowns in machines and also outages in software.
With power comes responsibility. The importance of ethics in Predictive Analysis:
Companies that use predictive analysis as part of their business are known to collect private and sensitive data of their customers to make future predictions or to better understand their customers. They track each user’s online actions and use it to their advantage. There are also other companies whose primary business is to collect and sell the sensitive data of netizens to third party people by which the concerned individual’s privacy gets compromised. In order to avoid data breaching, several countries have come up with regulations regarding the type of data that can be used in PA. Countries have incorporated rules that prevent prediction based on age, color, disability, ethnicity, family status, gender identity, labor union membership, military status, national origin, race, religion or belief, sex, sexual orientation, or any other inappropriate factor. Companies cannot differentiate based on these factors in order to make predictions. There are auditors and other legal personnel who are specifically meant to ensure that data collected and used is as per ethical standards.
Summing It Up:
Predictive Analytics is basically the process of automating scientific discovery.
PA is generally used to solve some real-world problem. Therefore, it becomes imperative that the entire team working on the PA project is well aware of and has understood the business problem that needs to be solved. That business objective has to be translated into the model objective.
It becomes the responsibility of the Domain Expert to explain and define the business problem or objective to the other team members. The other team members then have to collaboratively work to translate this business objective into the model objective.
References:
- http://www.tylervigen.com/spurious-correlations
- Predictive Analytics: The Power to Predict Who Will Click, Buy, Lie, or Die by Eric Siegel