

What is SonarQube ?
Most of you might have heard about Sonar or SonarQube as an automated code review tool. That's right! However, SonarQube is not limited to only performing automated code review and providing a list of findings.
As the documentation aptly says, it is an open source quality management platform which helps in continuous analysis and measurement of technical quality of source code. It gives high level snapshot of code quality measured against configured coding standards/ best practices.
There is ample documentation available on SonarQube website. This blog will help you to filter out the key information and provide a quick introduction of SonarQube and how it works.
How does it work?
SonarQube takes project code as the input, analyzes it using pre-defined coding rules and publishes web based results giving overview of technical quality of code.
Results summarize the status on project level which can be informative to management and is also possible to go on the issue level to see specific line of code causing the rule violation. This feature makes it very useful to developers to take quick action.
· Project code as input
SonarQube can analyze source code in 20+ different languages. Input can be the project source code or compiled code depending on the language. Below table summarizes the available options:
| Type of analysis | Languages supported |
| Static analysis of source code | All (Java files, COBOL programs, etc.) |
| Static analysis of compiled code | Certain languages (.class files in Java, .dll files in C#, etc.) |
| Dynamic analysis of code | Certain languages (execution of unit tests in Java, C#, etc.) |
· Rules
Analysis is carried out using pre-defined rules based on industry coding standards /best practices. Rules for a particular language are available as plug-in for most of the languages.
Quality Profile
Each language plugin comes with a predefined, built-in profile (called "Sonar way") having set of pre-defined rules and it will be used as default profile during analysis for projects.
New quality profiles can be created to configure rules as per project requirements, but it’s optional.
SonarQube allows inheritance in quality profiles thereby allowing to inherit rules provided by plugin in the default profile.
Custom Rules
It is possible to create custom rules. Custom Rules are considered like any other rule, except that they can be fully edited or even deleted.
Rule Templates are provided by plugins to allow users to define their own rules in SonarQube.
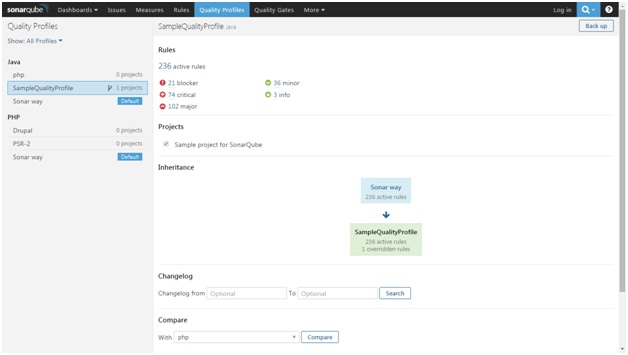
Sample – Quality profile and customizing rules
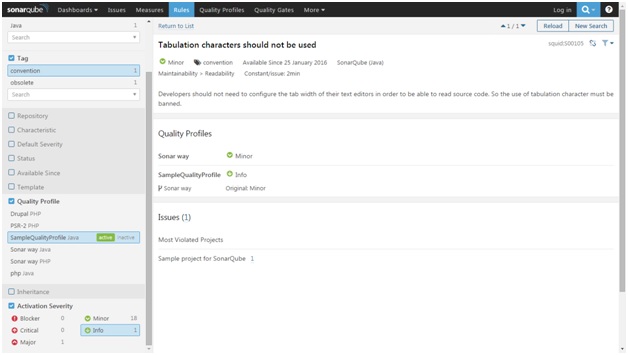
In the following screenshot, a new quality profile called “Sample Quality Profile” is created.
It is activated for project “Sample project for SonarQube”.
It inherits 236 active rules from default java profile “Sonar Way”
Based on project need, changes can be made in the child profile. E.g. changing severity of certain rules for project. The following screenshot shows how severity of a rule can be changed to info from minor.
· Triggering analysis
The SonarQube Scanner is recommended as the default launcher to analyze a project with SonarQube. Various versions of SonarScanner are available for command line, Ant, Maven, Jenkins etc. Analysis can be carried out in following modes.
| Mode of analysis | What is done? | Usage |
| Publish | Full analysis on the entire code base Saves results to the database | To analyze entire code base once and update central server |
| Preview | Full analysis on the entire code base Does not send results to the database | To get quick feedback about the issues before pushing code changes to main code base |
| Issues | is a "preview" equivalent intended for use by tools. | Not required to be used manually |
· Understanding the results
After the analysis, results are published and made available on SonarQube web console.
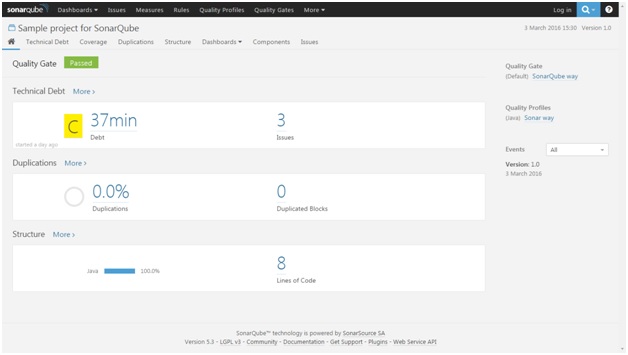
On project level, it gives a snapshot of overall issues with severity wise breakup, duplications, technical debt etc.
Issues
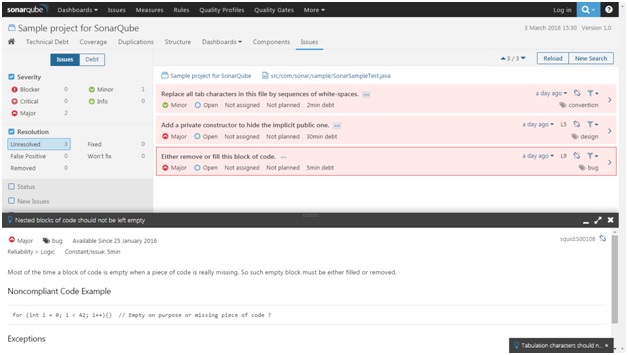
During analysis, SonarQube raises an issue whenever a piece of code breaks a coding rule. Developers can also manually raise issues that cannot be detected by SonarQube (examples: the implementation of the method does not comply to the functional requirements, the javadoc of the method does not match its implementation, etc.). Each issue has one of the five securities e.g. blocker, critical, major, minor, info.
Technical Debt
Technical debt is the estimated effort in days to fix the issues. The computation of technical debt in SonarQube is based on the SQALE (Software Quality Assessment based on Lifecycle Expectations) methodology. In order to manage technical debt with SQALE, it is required to enable rules in the Common SonarQube repository that flag:
- Duplicated blocks
- Failed unit tests
- Insufficient branch coverage by unit tests
- Insufficient comment density
- Insufficient line coverage by unit tests
- Skipped unit tests
Rules are in the Common SonarQube repository because they're common to all languages.
Sample – Project analysis results & drilled down view of an issue
The following screenshot displays the technical debt and 3 issues.
The following screenshot shows detailed version of one of the issues.
Installation & steps to run the analysis
Softwares
- Download and install following software which are required to carry out analysis.
Updating sonar-project.properites
- Create a sonar-project.properties file at the root of your project <project_root_directory>
# Required metadata
sonar.projectKey=org.sonarqube:php-xornet
sonar.projectName=PHP :: Xornet:: SonarQube Scanner
sonar.projectVersion=1.0
# Comma-separated paths to directories with sources (required)
sonar.sources=<src_directory>
# Language
sonar.language=php
# Encoding of the source files
sonar.sourceEncoding=UTF-8
Steps to run the analysis
- Start MySql server if not already up
- Start Sonar server using <sonar_installation_directory>\bin\<OS>\StartSonar executable
- Watch for any startup errors.
- If no errors, then try accessing the web console at http://localhost:9000
- Run sonar-runnercommand from the project root dir
- Follow the link provided at the end of the analysis to browse your project's quality in SonarQube UI . Please note that it does take some time for the analysis to show up on web link under the project.
- Once the analysis is successful then the project will show up on the dashboard screen.
References
http://docs.sonarqube.org/display/SONAR/Documentation
https://dzone.com/articles/why-sonarqube-1
http://www.midwesternmac.com/blogs/jeff-geerling/ci-deployments-code-analysis-drupal-php
http://docs.sonarqube.org/display/SONAR/Analyzing+Source+Code




 View Previous Blog
